My MRS135 spectrograph does not have a reference spectrum and does not have a means of determining the precise angular position of the grating. (The recent addition of micrometer adjustment of the rotation of the diffraction grating does give a good indication of the wavelength, but is not sufficiently precise to determine exact correspondence between pixel position and wavelength). Hence, it can be difficult at times to determine the wavelengths of lines, corresponding to their pixel positions. My MRS135 spectrograph does now have micrometer-controlled grating angles but these would not be precise in their estimates, though it is useful for dialling up the wavelengths desired .
The method I use is to try to identify certain lines of known wavelengths and to use these to estimate the wavelengths of other lines at given pixel positions.
It is also important to know how reliable are one’s estimates and this involves a branch of statistics known as regression. The dispersion of the spectrograph is not perfectly linear, i.e. it varies slightly depending on the pixel position, but a relationship which is linear can be found and then Linear regression can be used. For the relationship which produces linearity, I make use of the specifications of the spectrograph and the central wavelength of the image and then use linear regression on the known lines to estimate the unknown wavelengths and their reliability. A good textbook on regression is Probability and Statistics for Engineers and Scientists, by Walpole & Myers, Macmillan, 1972.
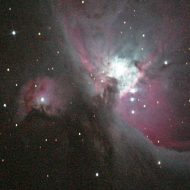
Below, I will give a link to an Excel spreadsheet for performing the regression and a link to a spectral image of α Ori, Betelgeuse. The image itself is not the best and was taken using a predecessor of the MRS135. However, many lines can be identified and the results appear to be reliable.
To use linear regression, I have introduced the variable X’, where X ‘ = λ /(C.Cos(β)) , where C is the constant 10000p/(k.m.f2) . (X’ is the dependent variable, usually denoted by y in a general discussion of regression.)
Then λ^ = C.Cos(β^).X ‘^ , where ^ indicates predicted, or estimated.
Now, the fundamental spectroscope equation is
Sin(α) + Sin(β) = k.m.λ/107.
Since, for a given image, α is fixed, say α0, we have
Sin(α0) + Sin(β^) = 10-7k.m.C.X’.Cos(β^)
= C’.Cos(β) , where C’ = p/(10 ³ .f2).X .
We can solve a quadratic equation for β and get
Sin(β^) = (-Sin(α0) +C’ √ [1+C’ ² -Sin ² (α0)])/(1+ C’ ² ) .
Then we get Cos (β^) and linear regression gives us X’^ and we find
λ^ from λ^ = C.Cos(β^).X ‘^
Here is the spectral image used in the spreadsheet.

I suggest that you link to the full-size image and copy it to be viewed in Photoshop.
The spectrograph details were:
m = 1200 lines/mm
p = 6.42 microns
γ = 35 degrees
f2 = 55mm
λ0 = 5200 A, in order
k = 1
The identifiable lines are:
Hydrogen Beta (H β), 4861.3A, at X = 1196
and the magnesium triplet
5167.3A at X = 872
5172.7A at X = 866 and
5183.6A at X = 854.
These Mg lines are in the green and are very easy to see in the Sun. I have seen a comment that they were the viewers favorite solar lines and I do not disagree. They are also mentioned and displayed in the website http://www.astrosurf.org/buil/us/stage/calcul/design_us.htm in a discussion on testing the spectrograph made there by viewing the solar spectrum, as reflected off a white card.
The spreadsheet calculates the slope, b, and the uncertainty in b which gives a 95% confidence Interval on the slope (Note that this slope is X’ vs X, not wavelength vs X). It also calculates a correlation coefficient which in this case is very close to -1, indicating very good agreement.
Select the URL below to see the spreadsheet.
https://www.keithforbes.org/wp-content/uploads/2019/02/MRS-Betelguese2_Web-1.xls
In this spreadsheet, 39 unknown lines are included. For each unknown line it calculates the best estimate of the wavelength ( λ ) and also the 95% Confidence Intervals on λ. The 95% confidence intervals on the unknown lines span a little over 1 Angstrom.