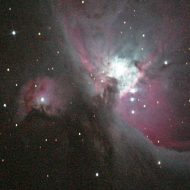
Betelgeuse, α Orionis
α Ori is spectral class M2, with a low surface temperature of 3400K. It
is well known to be a red giant star with a distinctive orange
appearance through binoculars.
I have one low-dispersion image (order +1) taken with a predecessor of MRS135 and a few higher-dispersion images (order -2) taken with MRS135. The first covers a smaller bandwidth than can be obtained with the MRS135.
The images have not been corrected for the spectrograph response (that is, flux calibration has not been done) see, e.g., Practical Amateur Astronomy, by Stephen F Tonkin (Ed.) (referred to herein as PAS), p160 for flux calibration. Usually, the bandwidth is quite large and the ends suffer from severe vignetting but the central regions suffer less from light diminution. See the article Design Specifications of Medium Resolution Spectrograph. Click here
When my images use positive orders, red is on the left end and, for negative orders, blue is on the left. I will standardize for blue on the left, i.e., wavelengths increase from left to right. Hence, for comparing images, I will rotate the order +1 image 180 degrees.
Images have been adjusted so that the dispersion is the same throughout the image (linearized), but of course it is different for different images.
Betelgeuse 1
Click the thumbnail to see the full image
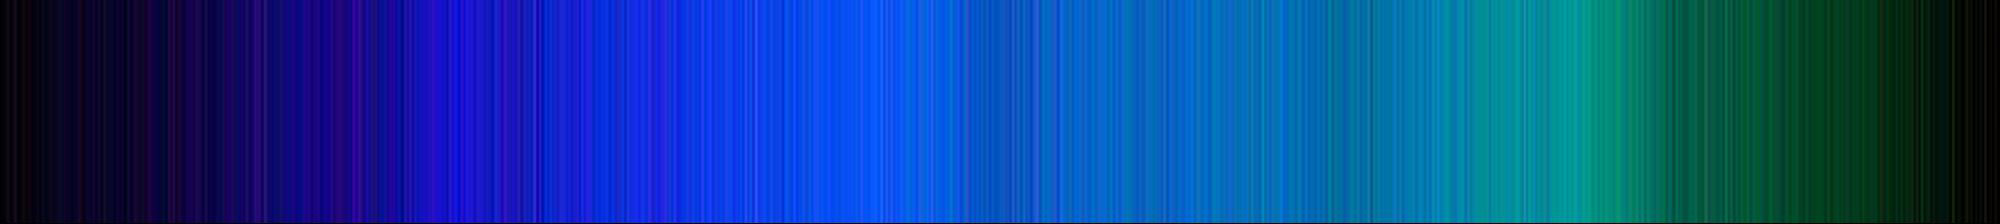
Order m = +1
The image has been reversed. From inspection of the image, I calculate the dispersion to be -0.9369 Angstroms/pixel with the wavelength for pixel 0 (if there was any light recorded there – which there is not) being 5983.7 A. These values are used in an Excel spreadsheet from which the profile below was derived.
I assume Hydrogen β (4861.3A) is at position X =802 and the Mg triplet (5167.3A, 5172.7A, and 5183.6A) is at X = 1128, 1135, and 1146.
A profile (an Excel graph of Intensity versus wavelength) which covers these wavelengths has been created.
See the Betelguese chart for the graph
The profile uses as intensity the sum of the Red, Green, and Blue values for each pixel in the binned file (refer to article Processing The Spectral Image). The drops in intensity which are visible in the spectrum are clearly seen in the profile. In particular, the big drops in the Blue ends of the molecular bands of TiO at wavelengths of 5167 and 4954 Angstroms are clearly seen.
Note: With a dispersion of approximately 1A/pixel, we cannot expect a resolution better than 2A (Shannon’s rule), so expressing the wavelengths to 1 decimal place is overambitious.
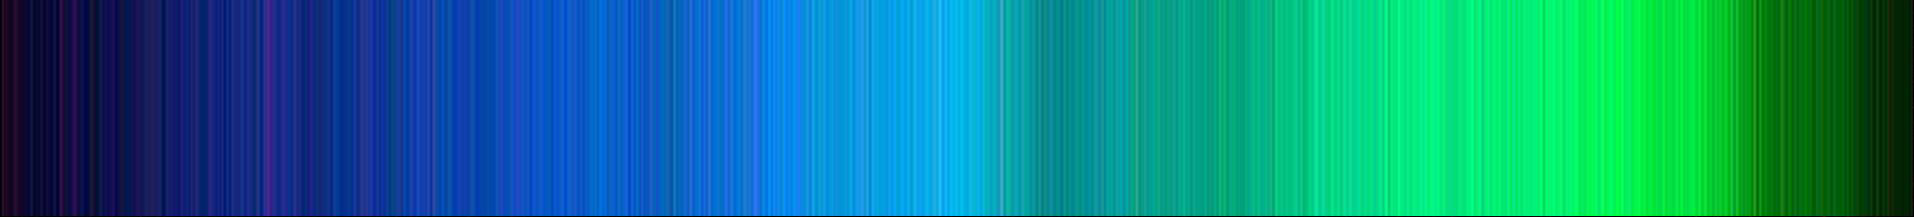
Betelgeuse 3
Click the thumbnail to see the full image
Order -2, Central λ = 5000A, estimated dispersion = 0.2729A/pixel. (This has been estimated from the assumed central λ and the specifications of the MRS135). Here we have Hydrogen β at X = 542 and the Mg triplet at X = 1702, 1723, and 1766.
From inspection of the image, I calculate the true dispersion to be 0.26322 Angstroms/pixel with the wavelength for pixel 0 being 4718.6A. An Excel spreadsheet uses these values and profiles are obtained from it.
Excel Chart1 shows pixel numbers ( 1500 to 1800) on the horizontal axis. The Mg triplet can be seen in the profile.
https://www.keithforbes.org/wp-content/uploads/2019/02/Betelgeuse_03Chart1.xls
Excel Chart7 shows wavelengths on the horizontal axis and covers the whole range of the spectrum.
htpps://www.keithforbes.org/wp-content/uploads/2019/02/Betelgeuse_03Chart7.xls
Again, the drops in intensity which are visible in the spectrum can be seen in the profile. Hydrogen β and the Mg triplet can be identified.
Betelgeuse 4
Click the thumbnail to see the full image
Order -2, Central λ = 5200A, estimated dispersion = 0.2579A/pixel.
The Mg triplet is at X += 1045, 1064, and 1105.
Note: To align the images under each other in Photoshop, if Betelgeuse1 is at 100%, Betelgeuse3 should be at 28.3% and Betelgeuse4 should be at 25.8% (to allow for the different dispersions).