Gamma Velorum or γ Vel, is a very hot Wolf-Rayet (WR), star of spectral class WC08.
It has been called the “Spectral Gem of the Southern Skies”.
A website which gives some data on WR stars is
https://www.cfa.harvard.edu/~pberlind/atlas/htmls/wrstars.html
The spectra of WR stars are beautiful in that they contain wide emission lines, as well as the usual stellar absorption lines. The emission lines are caused by hot gas surrounding the star and moving at high speeds.
γ Vel is a Carbon WR star, with chief emission lines:
He II 4686A
C III 5696A
C IV 5805A
Here is a spectrum taken with the MRS135
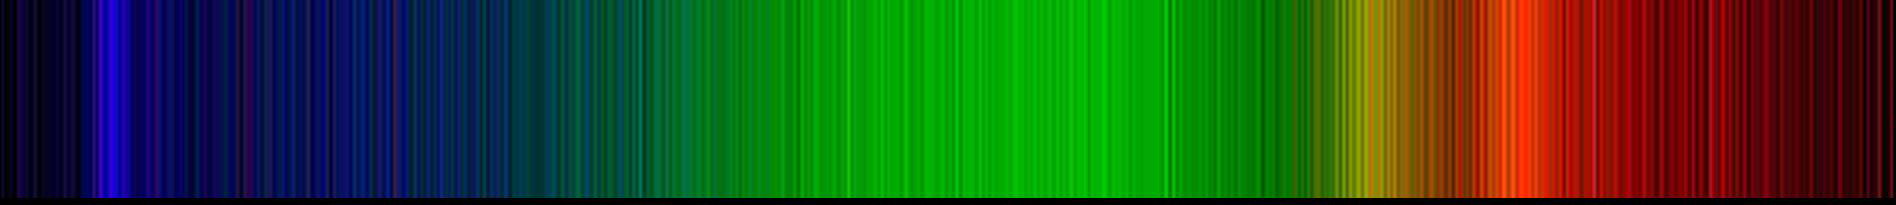
Click the thumbnail to obtain a full-sized image. If you save the image and examine it in Photoshop, you can see the pixel positions that I refer to.
The emission lines are broad but they are roughly at:
He II X=114
C III X=1370
C IV X=1520
This image has been linearized and the estimated dispersion, based on the specifications of the MRS135 and a central wavelength of 5400A in order -1, is 0.8095 A/pixel. The values of the emission lines and several unknown absorption lines have been entered into a spreadsheet . It does a linear regression based on the 3 lines and estimates the unknown wavelengths based on this. (The dispersion based on the regression is 0.7991 A/pixel.) As a comparison, it also uses the X-position of the single He II line and the estimated dispersion to calculate the other wavelengths. The linear regression gives a 95% Confidence Interval for the estimates. The ranges of the estimates are quite large, e.g. 20A either side of the prediction, because the emission lines are broad and there is some uncertainty in their pixel positions.
I do not know which atoms or ions are represented by the absorption lines.
The above image was taken in order -1 in the MRS135 and therefore has low dispersion.
Other images have been obtained at higher dispersion,i.e. smaller values of Angstroms per pixel, in order -2.
Some of these are shown below:
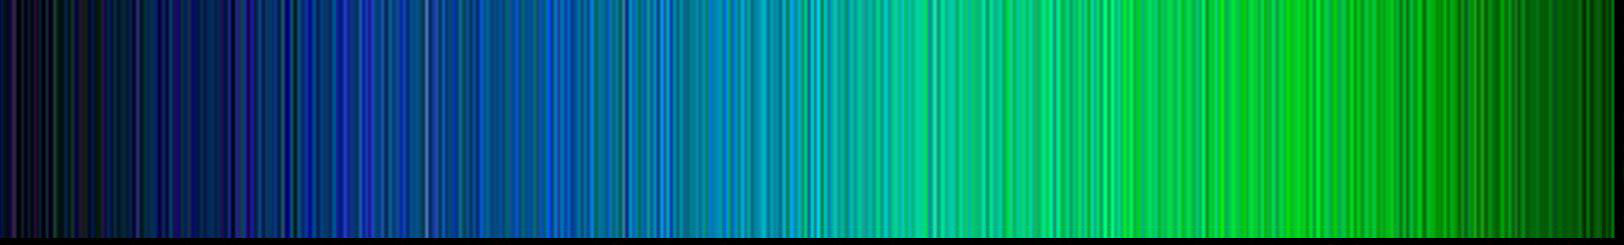
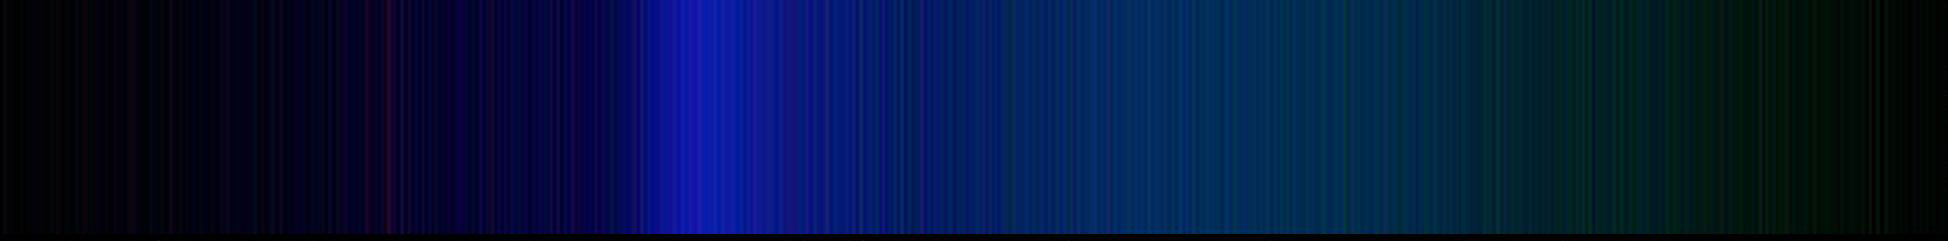
The dispersions, in A/pixel, for γ Vel 08 , γ Vel 09 , and γ Vel 10 are 0.2661, 0.2801, and 0.2508 respectively.
It is tedious, but possible, to align the 3 images to the same wavelengths and also to align them with the low-dispersion image. This can be done by viewing them in Photoshop with different zooms, as determined by the different dispersions. Use 100% for the low-dispersion image, 33.3% for γ Vel 08 , 35% for γ Vel 09, and 31.4% for γ Vel 10. Often, what looks like a single, wide, line in the low-dispersion image appears as 2 or 3 lines in the high-dispersion image.
For example, the following line up:
| γ Vel | 375 | 384 | 392⁄396 | 798 | 806⁄812 |
|---|---|---|---|---|---|
| γ Vel 08 | 233 | 263 | 287⁄293 | 1486⁄1498 | 1528⁄1546 |
and
| γ Vel | 806⁄812 | 902 | 911 | 922 | 1170 | 1210⁄1215 | 1222 |
|---|---|---|---|---|---|---|---|
| γ Vel 10 | 187⁄206 | 496⁄505 | 537 | 559 | 1335 | 1452/1469/1478/1488 | 1503 |
This looks encouraging for the higher-dispersion images being accurate, since they have not been heavily processed (that is another story) but I cannot be sure for this star since I do not know what the lines represent.
Spectra have recently been taken using the EOS 350D which has had the Infra Red blocking filter removed. This allows the spectrum to be seen for wavelengths well above 7000A. At this stage, I show just one of these images, along with a graph (profile) created from an Excel spreadsheet which has imported the data. (Infra Red spectroscopy using the EOS350D is further discussed in the Stellar Spectroscopy page and examples are given in the Sirius page.)
Click the thumbnail to see the spectrum

This profile can be compared with that given for WC8 stars in the website referred to above, viz. https://www.cfa.harvard.edu/~pberlind/atlas/htmls/wrstars.html
The image taken with the EOS 350D was just a Jpeg image, giving a maximum ADU of 255 in each of the 3 channels. The sum of the R, G, and B values have been used to create the profile.