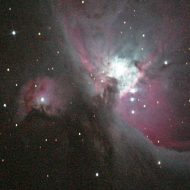
The image may be that of a slit, onto which an extended object has been focused, or simply that of a star when the spectrograph is used in slitless mode. The former would be used for the Sun (carefully, or off a cloud or other reflective surface), the moon, planets or nebulae. A slit would also be used for testing and calibrating the spectrograph by using an artificial light source such as a Hg or Ne lamp.
The website http://astrosurf.org/buil/us/stage/calcul/design_us.htm discusses the initial processing of a slit-image for handling TILT and curvature of the lines. If no slit is used, this should not be necessary as the image should not be many pixels high. I will discuss this latter case now.
When imaging the spectrum of a star, the aim is to obtain a long spectrum which is as narrow as possible. Narrowness indicates that the star has been focused well, has not drifted during the exposure, and that the astronomical seeing is good. In taking the image, this can seem to be a problem as it is very hard to see the spectrum in the camera viewfinder and even on the camera screen after the image has been taken unless it is zoomed in. It is tempting to expose a wider image for the reasons just given but that means a lack of focus and is not desirable. With the MRS135, if I get it right the image may be only about 5 pixels high (32 microns on 350D detector).
The first thing to do is make the spectrum horizontal and I do this in Photoshop by rotating the image. How much rotation is needed depends on how well the components of the spectrograph have been aligned. It also depends on the spectral order of the image. I usually have to rotate between 0 and 5 degrees. The image can then be cropped in Photoshop. I usually crop to about 2000 pixels by 200 pixels high.
The next thing to do is bin the image. Although the image may appear to be two-dimensional, it needs to be reduced to a one-dimensional array of numbers. Here, it is important to understand what a spectroscope (or spectrograph) actually does. It produces multiple images of the star, or of the slit, at different wavelengths and each image spreads horizontally and vertically an amount which ideally should be as small as possible. Too much horizontal spreading degrades the spectrum while vertical spreading diffuses the light over several pixels. Hence, the light (or photons) diffused vertically over several rows can be added to give a single number *corresponding to that pixel position, and corresponding wavelength. Sometimes, the image is so bright that addition would exceed the maximum value for an image (in Jpeg, this is only 255), so the rows can be averaged rather than added.
When this 1-dimensional array of numbers has been created, it can either be converted to a graph (giving the spectral profile) or it can be copied to enough rows to enable the spectrum to be clearly seen when its image is displayed on the computer screen. With my software, I spread it over 100 pixels and display it.
[* In fact, since I usually process in color, 3 numbers, one for each of R, G, and B, are created. Also, if I want to do further calculations on the spectrum, rather than just look at it, I calculate the “intensity” for each pixel and use that.]
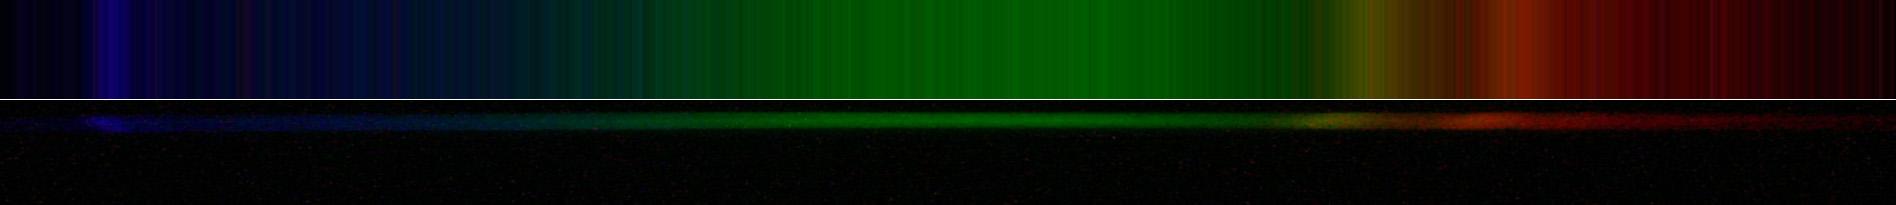
As an example, here are 2 software-processed images of a single spectrum taken of Gamma Velorum. Each shows the actual spectrum at the bottom and the binned spectrum, spread over 100 rows, at the top. Note that, a linearization of the image has also been done so that the spectral distribution, in Angstroms per pixel, is the same for all wavelengths. In fact, in this case it is estimated to be 0.810A/pixel. This is why the features in the unprocessed image do not line up perfectly with those in the processed image. This linearization can be avoided if desired.
The first one was averaged over a few rows:
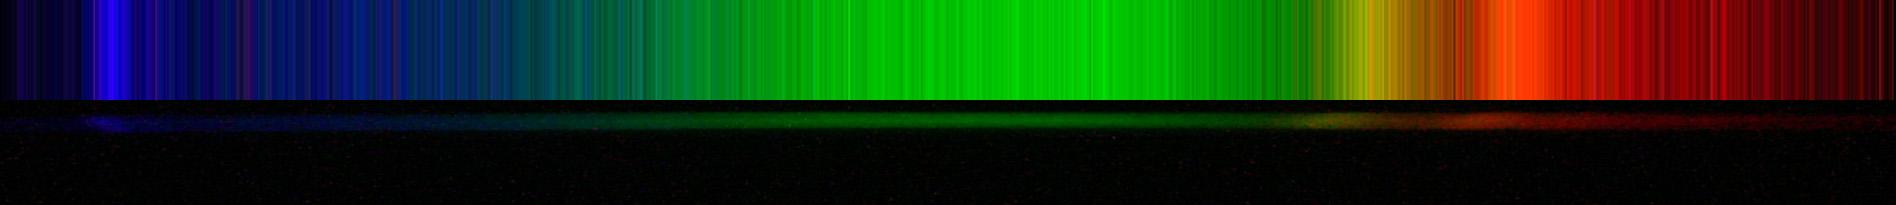
and the next one added the values in 2 rows.
Expand the thumbnails to look more closely.
The obvious difference is of course that the second image is brighter. This is not vital since the processed image can be brightened with further processing.
The difference between the raw spectrum and the image produced by software is stark. The lesson here is that your raw image may not look impressive but may still be good.
The processed image can be further enhanced by performing a gentle 1-dimensional sharpening on the array of numbers created by binning. Of course, it is important to be careful to not introduce artifacts, so this enhancing should not be overdone.
The next image comes from the first by brightening and sharpening. Of course, if you save the image in Photoshop, you can brighten it there.

It is now necessary to convert pixel positions of lines to wavelengths.